
What Should I Do With My General Electric Shares?
Recently, I had a conversation with a friend, who told me that he had just inherited General Electric (GE) shares, which his grandfather had bought several decades ago, and he wanted to know what to do with those shares? Well, I told him that I was not an accountant or a retirement planner and that I did not know what his tax situation was, but nevertheless I would have my Friedrich Algorithm analyze General Electric for him and then let him know.
I would assume that there are a lot of readers on Seeking Alpha that are experiencing the same problem, therefore I have decided to put it all in an article in order to help as many people as I can at one time. Now I don’t enjoy writing negative articles about stocks, as I tend to get upset when I read negative articles about the stocks I own, but in this case, I felt that I had no choice, because in the end, I would be helping more people than I would be hurting by telling them that General Electric is a company with serious problems.
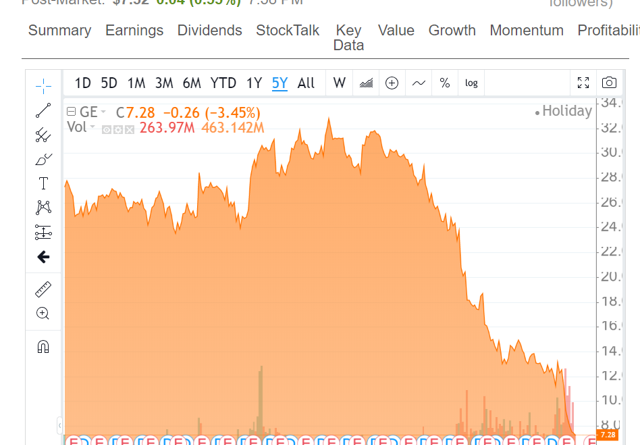
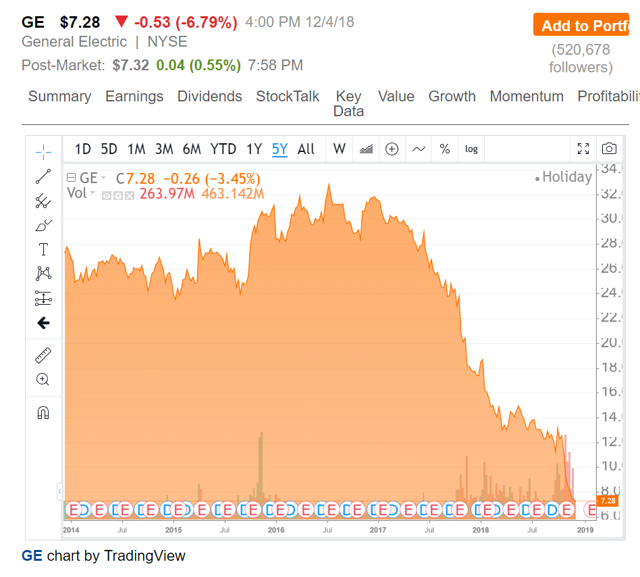
A while back, a subscriber of mine asked me the same question when General Electric was selling for $25 a share. His broker had him in a very large position, and he was very nervous as to what to do. In answering his question, I told him to sell all his shares at the time, as I had predicted that General Electric shares would be selling for $10 by Christmas 2018. He relayed this message to his broker and asked him to sell the General Electric shares in his account. His broker disagreed and put up a serious fight in order not to sell, but in the end, did so on my subscriber’s insistence. I am sure there will be many readers of this article who may disagree about what my Friedrich Algorithm predicts about General Electric, but Friedrich was correct about the $10 share price by Christmas 2018, and then some, as the closing price on December 4th was as follows:
On November 30, 2018, Seeking Alpha’s Senior News Editor Carl Surran reported this “GE price target cut to $7 at Deutsche; shares down 5%”, so I am not the only analyst who believes that General Electric is in serious trouble. In this article, I will not discuss the various operations and how each is doing, as you can read dozens of such articles on Seeking Alpha, both pro and con. What I will simply do is a quantitative analysis of General Electric’s results on Main Street and then relate them to what an investor should do on Wall Street, using zero emotion.
Main Street vs. Wall Street
In analyzing General Electric, we will present some unique ratios that our Friedrich Investing System uses and will present a real-time quantitative analysis that will demonstrate the power of free cash flow in the investment process. In doing so, we will also teach everyone how to analyze one’s portfolio holdings on Main Street vs. Wall Street. At the same time, we will explain how the methodology involved in this analysis came about.
Main Street is where General Electric operates and Wall Street is where its shares trade. The General Electric shares that one can purchase on Wall Street are in the public domain, and the company has little control over how each share will trade. General Electric is required to release its earnings reports each quarter and from time to time, it also provides press releases to its shareholders (and the general public) giving updates on how its operations are doing on Main Street.
Main Street is where General Electric invests in its own operations and sells to its customers. How well the CEO of General Electric and its management do in selling those products determines how profitable the company will be. Wall Street then reacts based on the success or failure of management to meet its goals. Main Street and Wall Street are thus interlinked, but because anyone with a computer (or even just a smart phone), an internet connection, and a brokerage account can buy or sell any stock at any time, expertise is not a requirement in order to invest on Wall Street.
This results in Wall Street being a very dangerous place to operate as many investors tend to invest through emotion or tend to follow the herd in and out of stocks. During bull markets, investors feel like they can do no wrong as “the rising tide lifts all boats.” But when a bear market suddenly shows up, these same investors tend to panic and like lemmings stampede over the cliff. Thus, we have the classic case of “greed vs. panic.”
Creation of the Friedrich Algorithm
Having noticed this problem some 30 years ago, I spent the last three decades building an algorithm called Friedrich. Our algorithm was designed to assist all investors (both Pro and Novice alike) and give them the ability to quickly compare a company’s Main Street operations, to its Wall Street valuation (Overbought or Oversold condition). Friedrich can do this on an individual company basis or assist users in analyzing an entire index like the S&P 500, an ETF, Mutual Fund, or individual portfolio with the use of our Portfolio Analyzer. I recently did so when I compared Apple (AAPL) to the S&P 500 Index (SPY) Apple Vs. The S&P 500: Which Is The Better Investment?
Many years ago, while reading Berkshire Hathaway’s (BRK.A) (BRK.B) 1986 letter to shareholders, I discovered a ratio, which Mr. Buffett entitled “Owner Earnings,” or what we may consider to be Mr. Buffett’s version of “Free Cash Flow.” To my amazement, in that little footnote, Mr. Buffett explains how to use it and basically states that it is one of the key ratios that he and Charlie Munger used in analyzing stocks. In that article, he defined the term “owner earnings” as the cash that is generated by the company’s business operations.
“[Owner earnings] represent [A] reported earnings plus [B] depreciation, depletion, amortization, and certain other non-cash charges… less [C] the average annual amount of capitalized expenditures for plant and equipment, etc. that the business requires to fully maintain its long-term competitive position and its unit volume.”
I have used this free cash flow ratio for decades, using data from the Value Line Investment Survey, whose founder was Arnold Bernhard. Mr. Bernhard was a big fan of free cash flow and probably introduced it sooner than Mr. Buffett did. I know this as I was able to calculate the FCF ratio using old Value Line’s sheets for my 60-year backtest of the DJIA from 1950 to 2009.
In the backtest that I mentioned above, I demonstrated that if one can purchase a company whose shares are selling for 15 times or less its Price to Free Cash Flow Ratio, that the probability of success will dramatically increase in most cases. I have renamed the ratio the Bernhard Buffett Free Cash Flow ratio in honor of both men. The following is how that ratio is calculated.
Price to Bernhard Buffett Free Cash Flow Ratio
Price to Bernhard Buffett Free Cash Flow Ratio = Sherlock Debt Divisor / [(net income per share + depreciation per share) + (capital spending per diluted share)]
Sherlock Debt Divisor = Market Price Per Share – ((Working Capital – Long-Term Debt)/Diluted Shares Outstanding))
The above are the ratios I use when analyzing a stock on Wall Street, and below are the ratios I use when analyzing a stock on Main Street.
FROIC
FROIC means “Free Cash Flow Return on Invested Capital”
Forward Free Cash Flow = [((Net Income + Depreciation) (1+ % Revenue Growth rate)) + (Capital Spending)]
FROIC = (Forward Free Cash Flow)/(Long-Term Debt + Shareholders’ Equity)
What the FROIC ratio does is tell us how much forward free cash flow the company is generating on Main Street relative to how much total capital it has employed. So, if a company invests $100 in total capital on Main Street and generates $20 in forward free cash flow, it, therefore, has a FROIC of 20%, which we consider excellent. This is just one of the key ratios (66 in total) that we use to identify how a company is performing on Main Street, as it is our belief that if a company is making a killing on Main Street that this news will eventually show up on Wall Street’s radar.
So, let us begin our analysis and at the same time try to teach everyone how to do a similar analysis on one’s own portfolio. In analyzing General Electric’s Price to Bernhard Buffett FCF ratio, we must first analyze General Electric’s Sherlock Debt Divisor. Here is a detailed definition of what that ratio is:
Sherlock Debt Divisor
A major concern that I have these days in analyzing companies is the amount of debt each takes on relative to its operations and whether management is abusing this situation by taking on more debt than it requires. Debt, when used wisely, allows for what is called leverage, and leverage can be extremely beneficial within certain parameters. On the other side of the coin, the use of debt can also be excessive and put a company’s future in jeopardy. So, what I have done to determine if a company’s debt policy is beneficial or abusive is to create the Sherlock Debt Divisor.
What the Divisor does is punish companies that use debt unwisely and rewards those who successfully use debt as leverage. How do I do this? Well, I take a company’s working capital and subtract its long-term debt. If a company has a lot more working capital than long-term debt, I reward it and punish those whose long-term debt exceeds its working capital. So, if this result is higher than the current stock market price, then leverage is being used and the more leveraged a company is, the worse the results of this ratio will be and the less attractive its stock will be as an investment.
Thus, having successfully defined the Sherlock Debt Divisor, we need the following four bits of financial data in order to calculate it for General Electric. TTM for those who don’t know is “trailing 12 months” or as close to real-time data as we can get, based on when each company reports.
Market Price Per Share = $7.28
Working Capital = Total Current Assets – Total Current Liabilities
Total Current Assets = $116,782,000,000
Total Current Liabilities = $107,558,000,000
Working Capital = $9,224,000,000
Long-Term Debt = $97,060,000,000
Diluted Shares Outstanding = 9,208,400,000 (increased by 536 million shares since 2017)
Sherlock Debt Divisor = Market Price Per Share – ((Working Capital – Long-Term Debt)/(Diluted Shares Outstanding))
Sherlock Debt Divisor = $7.28 – ((9,224,000,000 – $97,060,000,000)/ 9,208,400,000 ))
Sherlock Debt Divisor = $7.28 – ($-9.54) = $16.82
Since General Electric has more Long-Term Debt vs. Working Capital, we, therefore, must punish it and use the new $16.82 as our new numerator in all our calculations.
Wall Street Analysis of GE
Price to Bernhard Buffett FCF Ratio = Sherlock Debt Divisor/[(net income per share + depreciation per share) + (capital spending per diluted share)]
Sherlock Debt Divisor = $16.82
Net Income per diluted share = $-31,239,000,000/9,208,400,000 = $-3.39
Depreciation per diluted share = $6,059,000,000/9,208,400,000 = $0.65
Capital Spending per diluted share = $-7,283,000,000/9,208,400,000 = $-0.79
$-3.39 + $0.65 + ($-0.79) = $-3.53
Price to Bernhard Buffett Free Cash Flow Ratio = $16.82/$-3.53= -4.76
Now, if one goes to our FRIEDRICH LEGEND (on what is considered a good or bad result), you will notice that our result of -4.76 is considered terrible.
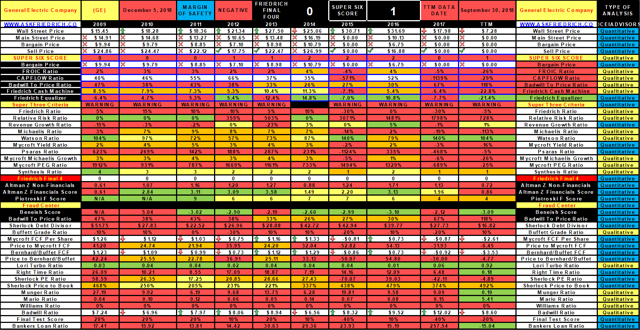
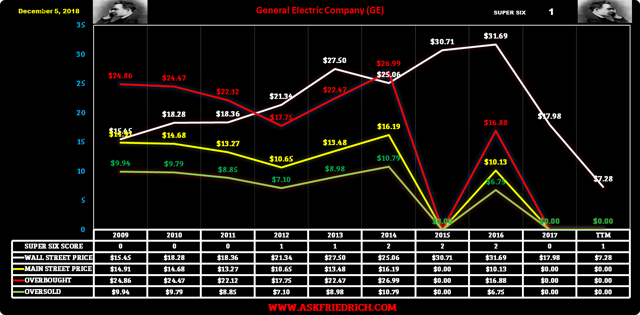
We last ran our data file for General Electric on December 5, 2018, and our Friedrich Algorithm gave a recommendation to our subscribers that General Electric is a “Strong Sell” as our Friedrich Data File and Chart below show. There you will also find the last ten years of General Electric’s Price to Bernhard Buffett Free Cash Flow results.
Main Street Analysis of GE
Now that we have taught everyone how to calculate our Price to Bernhard Buffett Free Cash Flow ratio, let us now move on and teach everyone how to calculate our FROIC ratio.
This is how we calculate it:
FROIC means “Free Cash Flow Return on Invested Capital”
Forward Free Cash Flow = [((Net Income + Depreciation) (1+ % Revenue Growth rate)) + (Capital Spending)]
FROIC = (Forward Free Cash Flow)/(Long-Term Debt + Shareholders’ Equity)
Net Income per diluted share = $-31,239,000,000/ 9,208,400,000 = $-3.39
Depreciation per diluted share = $6,059,000,000/9,208,400,000 = $0.65
Capital Spending per diluted share = $-7,283,000,000/9,208,400,000 = $-0.79
Revenue Growth Rate TTM = 1%
[(($-3.39 + $0.65) (101%)) + ($-0.79) =$-3.51
Long-Term Debt = $97,060,000,000
Shareholders Equity = $31,454,000,000
Diluted Shares Outstanding = 9,208,400,000
FROIC = (Forward Free Cash Flow)/ (Long-Term Debt + Shareholders’ Equity)
$-3.51/$13.96 = -25%
FROIC = -25%
Now, if one goes to my FRIEDRICH LEGEND again (on what is considered a good or bad result), you will notice that our result of -25% is a terrible result and tells us that General Electric on Main Street loses $-25 in forward free cash flow for every $100 it invests in total capital employed.
On Main Street, General Electric is doing terrible, while on Wall Street it is just as bad. Now, if one can build a portfolio by avoiding stocks like General Electric and only concentrate on those companies with excellent Main Street results and buy all at attractive Price to Bernhard Buffett Free Cash Flow ratio results, then your portfolio should be a star on both Main Street and Wall Street. Finding companies that have excellent results on Main Street and Wall Street (simultaneously) these days is, unfortunately, like trying to find a needle in a haystack.
What To Do?
Going Forward, you will notice that for the Main Street price in our Datafile for General Electric above, we assigned it a $0 result. We did this because we have a firm rule that whenever a company produces a negative Bernhard Buffett Free Cash Flow result, we automatically assign it a $0 result. This is done because we want our subscribers to avoid such investments, just as a private buyer on Main Street would never invest in a business that is losing money hand over fist. If we were to do anything with General Electric shares, we would be shorting instead, even at this level, as we see it going much lower. We can say that because the company has a Badwill to Price of 118%. Badwill is a ratio that I created that concentrates on a company’s Goodwill + Intangible assets and shows potential manipulation or, in rare cases, fraud by management. Anytime that ratio goes above 100% and the Main Street Price is $0, that is our Friedrich Investing Systems key to identifying a strong short position. Here is the official definition:
BADWILL = Is a way in which Friedrich catches manipulators. When companies do a lot of mergers and acquisitions, they tend to book a lot of Goodwill.
BADWILL = (Goodwill + Intangible Assets)/ Diluted Shares Outstanding.
When the Badwill to Price is 33% or greater than the stocks market price, we generally consider it to be a bad thing. When it breaks above 100%, then it becomes a potential short candidate. In the end, our Friedrich Investment System not only recommends selling General Electric at its current level, but actually believes it could also be a potentially effective short.
In conclusion, it is my belief that free cash flow analysis is the ultimate tool when analyzing companies, and my hope is that you may add these ratios to your own investor toolbox in order to help you in your own due diligence. If you have any questions, please feel free to ask them in the comment section below.
Disclosure: I am/we are long AAPL.
I wrote this article myself, and it expresses my own opinions. I am not receiving compensation for it (other than from Seeking Alpha). I have no business relationship with any company whose stock is mentioned in this article.
Additional disclosure: This analysis is not an advice to buy or sell this or any stock; it is just pointing out an objective observation of unique patterns that developed from our research. Factual material is obtained from sources believed to be reliable, but the poster is not responsible for any errors or omissions, or for the results of actions taken based on information contained herein. Nothing herein should be construed as an offer to buy or sell securities or to give individual investment advice.
Powered by WPeMatico